
Delving further into the police.uk website, we’ve found four charts:
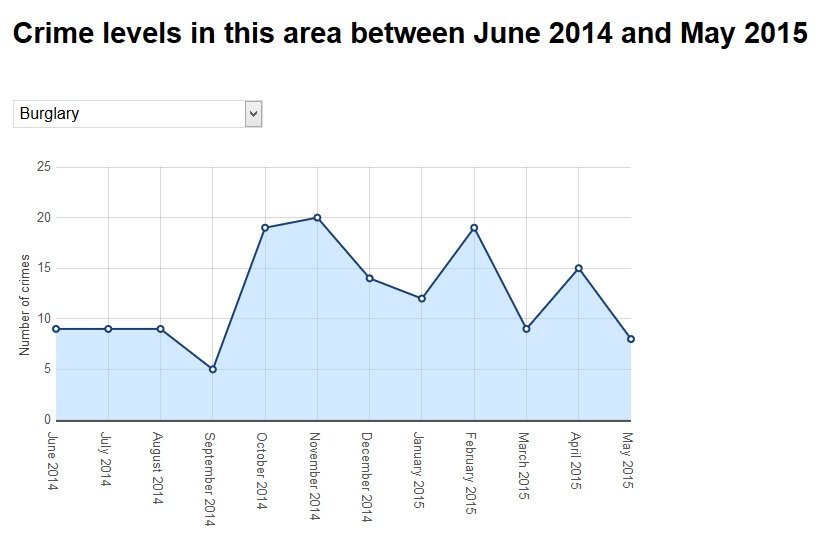
First of all, a chart showing the number of burglaries in Rayleigh each month for the past year:
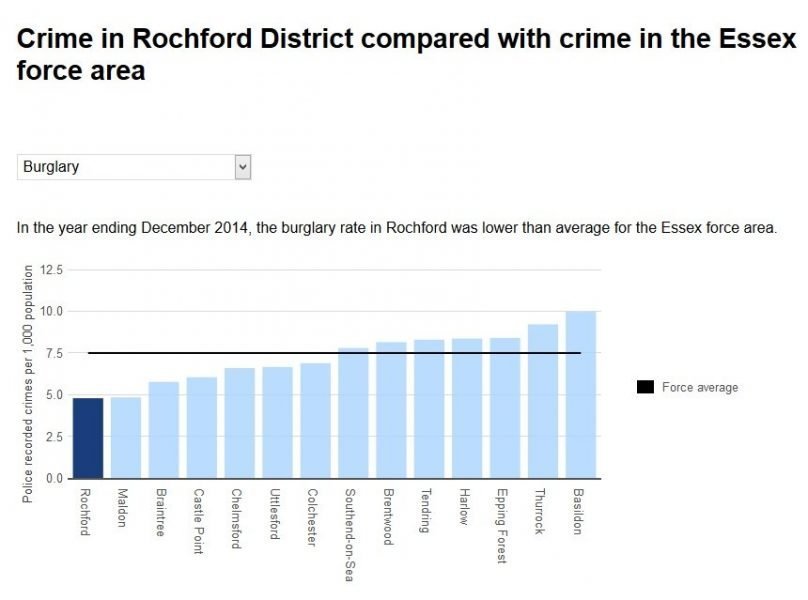
Secondly, a chart showing Rochford District has the lowest number of burglaries in Essex per head of population:
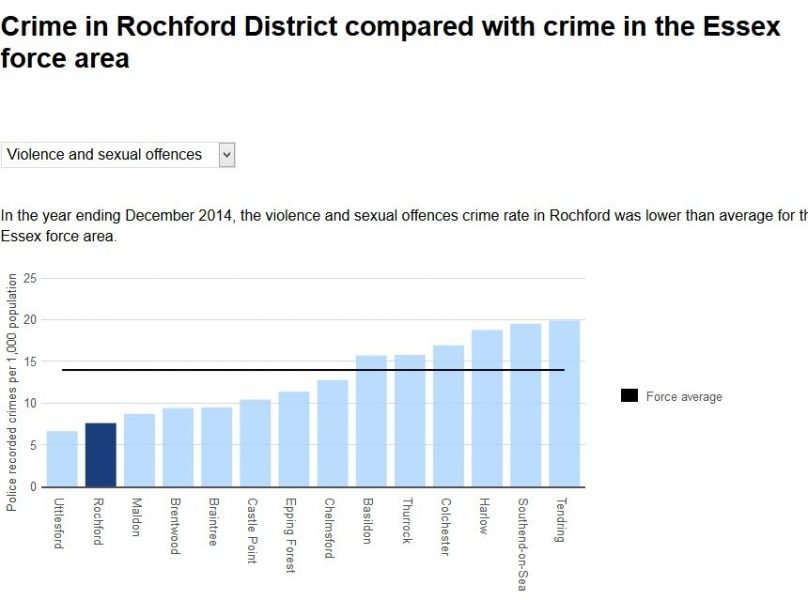
Thirdly, a chart for violence and sexual offences – we come second lowest in Essex per head of population:
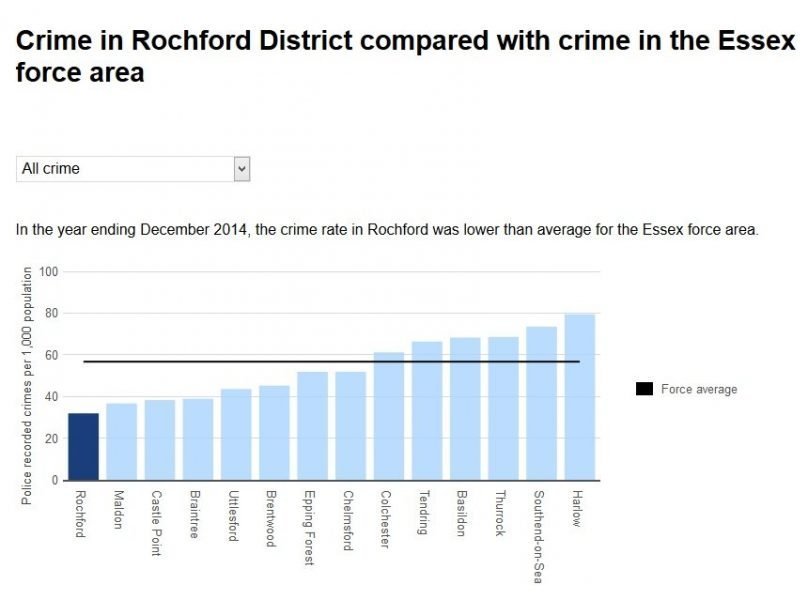
and finally a chart showing that Rochford District has the lowest number of all crimes in Essex per head of population:

If you smoothen the burglary plot by taking a 3 month moving average it will show a clear seasonal variation – more daylight, less burglary.
It would be interesting to see how the plot has changed over the years.